Barrett Culture Score
- Nov 24, 2025
- 6 min read
A Powerful Metric to Understand Cultural Health
Gross Margin. Net Promoter Score. Market Share. Leaders regularly use these key metrics to determine how their organisations are performing. Now it is possible to have a similar measure to monitor their organisation’s culture.
The Barrett Culture Score combines the essential drivers of a culture to provide a powerful indication of the health of the organisation. It is an insightful, comprehensive, and actionable score to help forge a targeted, measurable path towards a thriving culture.

Key Benefits
Offers an expansive view of culture and cultural priorities through the combination of factors that make up the score.
Gives an indicator to track cultural evolution.
Provides a comparison by industry and across all organisations.
Provides a proxy indicator for better leadership, engaged employees, happier customers, and care for the community and the environment.
Calculating the Culture Score
The Culture Score combines three important factors:

Why These Factors Matter
Alignment: Number of matches between Personal values and Current Culture
The measurement of alignment between top Personal and Current Culture values highlights the degree of engagement between what is most important to the people personally and their experience at work. A high degree of alignment suggests that employees feel a strong sense of connection to their work.
Alignment: Number of matches between Current and Desired Culture

The measurement of alignment between Current and Desired Cultures highlights how much employees believe the organisation is on the right track, or not. Connecting what employees now experience within the culture to what they believe would best support the organisation in achieving its highest potential, gives insight into what is necessary for the future, based on the wisdom of the collective.
Dysfunction: Degree of Cultural Entropy

Cultural Entropy measures the degree of lost productivity, conflict, and/or stress in the system. The lower the Cultural Entropy score the more employees can contribute their skills and talents to the success of the organisation. This creates conditions for greater employee engagement, adaptability, and creativity, thus leading to higher performance, profitability, and sustainability.
Balance Index: Balance between Foundation needs and Impact focus

The most successful and sustainable organisations apply a balance of focus to their foundational needs (Levels 1 - 3) and their ability to make an impact (Levels 5 - 7). Too much attention to foundational needs inhibits the ability to have a lasting impact internally and externally, while too much attention to impact neglects the basic areas necessary to operate and financially support the business effectively. Similarly, a relatively high degree of change in focus requested in the area of Evolution from Current to Desired Culture, may indicate that people see too much or too little change currently.
Comparisons
While each culture is unique, it can be helpful to have a reference point to see how the organisation compares to others in similar areas. The Culture Score includes the industry and global average scores as shown in the diagram below. It is important to remember the intention of cultural measurement is the development of your own culture rather than trying to imitate others.
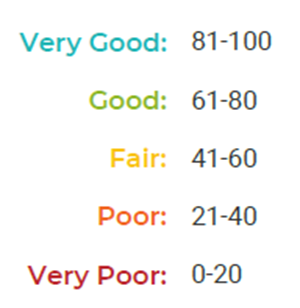
The Culture Scores range from 0 to 100. Organisations will fall into one of the following groups, depending upon their score:
Based on the assessments we have done to date, the scores range between:
Highest score: 94
Lowest Score: 6
Working with the Culture Score
Example Culture Assessment: Manufacturing Sector

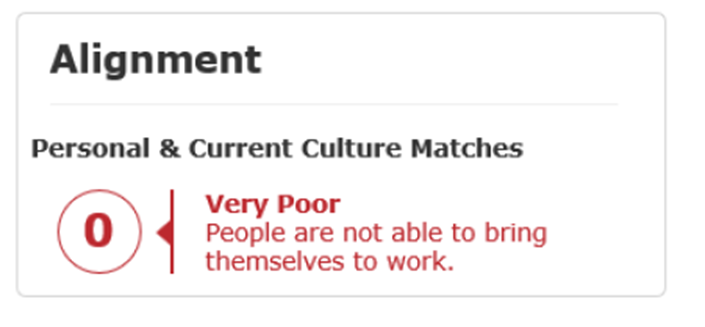
This group has a Culture Score of 33, which is below average for its industry.
The factors that have contributed to this are shown in the Summary of Results:
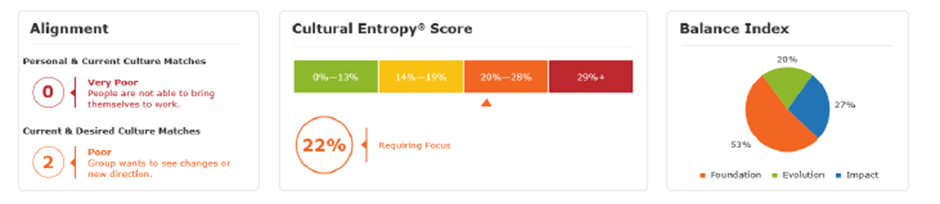
There are no matching values between Personal and Current Culture.
There are two matching values between the Current and Desired Culture.
Cultural Entropy is 22%.
There is 53% focus on Foundation and only 27% on Impact. Little change in focus is requested in the area of Evolution.
The opportunities to raise the Culture Score and, therefore, the health of the organisation include:
.Alignment Review the new values requested in the Desired Culture.
What might be missing for people currently?
Which of their personal values are seen as important for the future and which may help people feel more engaged?
Which value(s) might be worthy of particular focus going forwards (e.g. using Template 3b in ‘Get Connected’ exercise from CVA to Action)
2. Cultural Entropy Examine the key issues people are facing as listed in the Cultural Entropy table.
Consider an Appreciative Inquiry exercise to focus on strengths and how the group can leverage these to help overcome some of the problem areas.
3. Balance The current imbalance in the Foundation area suggests that potential is being limited by a lack of focus in the area of Impact.
How clearly expressed, communicated, and understood is the purpose of the business?
How collaborative and connected is the internal community of the organisation?
How well are people allowed to express their genuine selves?
To what degree is a greater focus on Impact requested in the Desired Culture? This may give an indication of what participants believe to be most important in this regard.
How does the current strategy and focus support business aspirations and what might be needed to strengthen alignment and collaboration across the group?
What is the attitude to change across the organisation?
Culture Score and Demographics
We are sometimes asked how it is possible for the Culture Score of an organisation to be so different from that of the groups that are subsets of the overall. For example, how is it that the Culture Score of the overall organisation is higher or lower than the average score of its departments?
When calculating the Culture Score, each group and its results are viewed on their own merits. Therefore, the overall group and each of its demographics are looked at in isolation, to get a separate Culture Score for each.
Usually, the combination of departmental entropy scores will have an averaging effect for the whole group. From a balance perspective, it is possible that one group with a high foundation focus could cancel out another with a high impact focus, with the result that the overall group will be more balanced and therefore healthier than the individual departments. With regard to matches, the top 10 values for the departments can vary and when combined, can result in a different combination of values matches, which may be higher or lower than the separate groups.
Here is an example of an organisation with only 2 departments, that illustrates this clearly:

Looking at the example above, you might expect that the combination of Department A & B, given that the number of participants is not too dissimilar, would create an average score that is nearly an average of 61and 18. In fact, the overall organisation had a Culture Score much nearer that for department B.
Alignment
Looking at the Personal and Current Culture Matches, individually, the departments scored 5 matches and 1 match respectively. However, in this case, when we combine all of the responses at a full organisational level, we see there is only 1 match between the Personal and Current Culture. Similarly, for Current and Desired Culture Matches the departments scored 5 and 0 Matches respectively and the overall organisation only 1. The impact of this is that Department A will score more on alignment than either the overall group or Department B.

Cultural Entropy
With regards to Cultural Entropy, Department A has the healthiest score at 16% suggesting that employees in that department are much happier than their colleagues in Department B, where the score is 38%. When combining these scores across departments to look at the overall organisational score, you will generally see an averaging effect, where departments are of a relatively similar size, as we see in this case, with an overall score of 29%.

Balance Index
An ideal result here would be a balance between the focus on Foundation and Impact. In this case, Department A is more balanced than Department B where nearly two thirds of all the available focus is Foundation biased. Again, we see an averaging effect on the overall group.
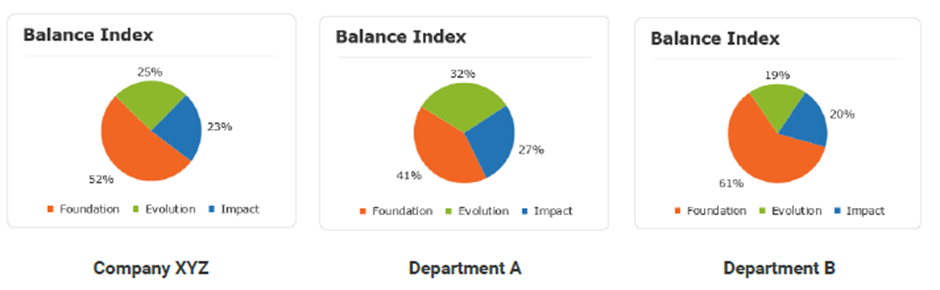
However, both the full organisation and department B showed a much higher shift in focus requested in terms of Evolution from Current to Desired Culture. This too suggests more of an imbalance for these groups which too will impact the overall Culture Score.