

Retention Is the New Recruitment
A practical strategic guide for building a stable, skilled and sustainable council workforce
Recruitment remains important, but a council cannot recruit its way out of avoidable turnover. Every preventable departure removes experience, relationships and organisational memory; increases pressure on those who remain; and can create a cycle of vacancies, agency cover, workload growth and further exits. Retention should therefore be governed as a service-resilience, financial and organisational-health priority, not treated solely as an HR measure.
The national picture makes the case. England’s directly employed council workforce stood at approximately 1.14 million people and 896,000 full-time equivalents in late 2025, having reduced by 16 per cent over ten years. In 2024/25, participating councils reported approximately 59,000 vacancies, 77,000 annual leavers, a 12 per cent leaver rate, 63,000 agency workers, 34,000 temporary workers and 9.3 sickness days per worker. Separately, 94 per cent of councils responding to a 2024 workforce survey said they had experienced recruitment and retention difficulties. These figures come from different collections and should not be treated as one perfectly aligned statistical series.
Profession-specific data show why a single corporate turnover figure is insufficient:
Children’s social work had 36,200 directly employed FTE social workers in September 2025, alongside 5,400 agency workers. Vacancies fell to 6,000, equivalent to 14 per cent, while turnover fell to 12 per cent. Agency reliance nevertheless remained 13 per cent and 74 per cent of vacancies were covered by agency workers.
Local-authority adult social care had 120,500 filled posts and 6,600 vacancies in September 2025. Turnover was 11.5 per cent, the vacancy rate 5.6 per cent and sickness averaged 10.5 days. Social workers accounted for 20,100 filled posts and occupational therapists 3,500; approximately 9 per cent of both professions were agency workers.
In planning, 79 per cent of responding departments reported recruitment difficulty, 44 per cent retention difficulty and 93 per cent skills gaps in 2025. These are weighted survey findings from 148 of 327 invited planning departments, not administrative counts.
A weighted finance survey estimated a 16 per cent vacancy rate and 12.5 per cent turnover in October 2023. Vacancy rates were particularly high for accountants, internal audit and business partners.
A weighted environmental-health survey estimated a 13 per cent vacancy rate and 11 per cent turnover in October 2023. Forty-eight per cent of respondents had held their hardest-to-fill vacancy for at least a year; an estimated 570 agency workers were in use and 2022/23 agency spending was estimated at £20.7 million.
The conclusion is not that every council has a crisis. It is that average figures conceal materially different risks by profession, team, tenure, location and career stage. Retention becomes manageable when councils can see those differences early, understand their causes and test proportionate responses.
The Council Retention Operating System
Retention should operate as a continuous management system: nine organisational conditions, examined through a seven-stage diagnostic and improvement cycle, with clear corporate accountability. The following model shows how those elements connect.
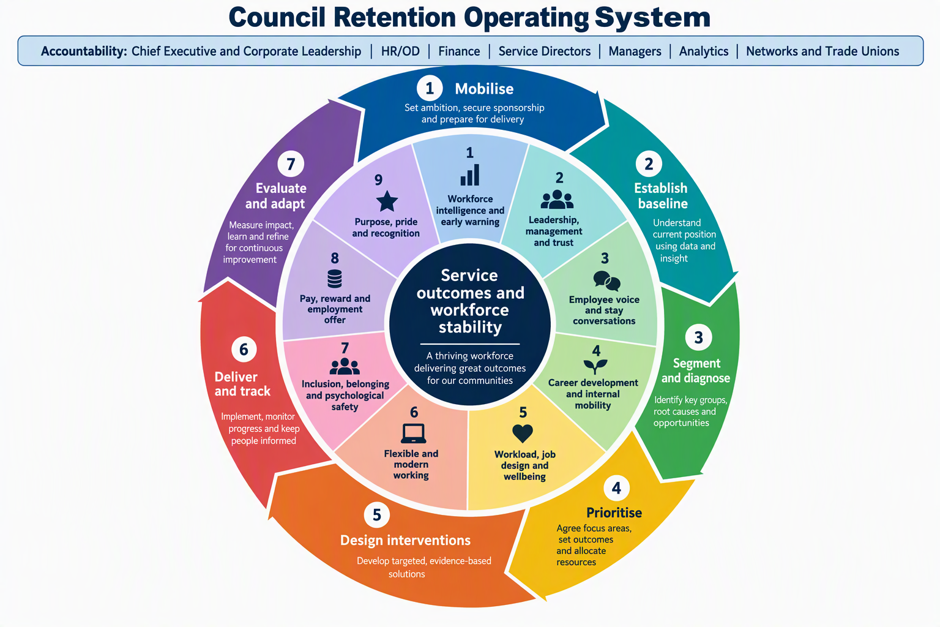
No single intervention is sufficient. Research generally associates management support, development, recognition, career opportunity and employee involvement with engagement and lower turnover intention, but much of the evidence is cross-sectional and context-dependent. Flexible working can support retention, yet benefits may be weakened by work intensification, unequal access or inconsistent implementation. Individual resilience training must never substitute for addressing unsafe workload, poor job design or weak organisational support.
Part One: The Retention Maturity Model
Use the model for self-assessment and improvement planning, not inter-council league tables.
Level | Observable evidence |
1. Reactive | Retention is discussed mainly after resignations or failed recruitment. Data are annual and corporate-level. Ownership is unclear. Exit interviews are inconsistent and interventions are untested. |
2. Aware | Corporate turnover and vacancy data exist. Some services identify hotspots. Employee surveys and exit data are reviewed, but connections between evidence, decisions and outcomes remain weak. |
3. Systematic | Named governance, agreed definitions, quarterly scorecards and segmented analysis are established. Critical roles are identified. Stay conversations, action plans and intervention measures are used consistently in priority areas. |
4. Integrated | Retention is embedded in workforce, service, transformation, finance and risk planning. Managers receive actionable information. Employee voice shapes interventions. Cohorts and differential outcomes are routinely evaluated. |
5. Adaptive | Leading indicators provide early warning. Interventions are tested, compared and refined. Benefits, unintended consequences and distributional effects are evaluated. Learning is shared while protecting local context and privacy. |
Scoring without false precision
Score each of six domains governance, data, management practice, employee voice, intervention design and evaluation from 1 to 5, requiring documentary evidence for the chosen level. Report the six-domain profile rather than relying only on an overall average. A council scoring 4, 2, 3, 2, 3, 1 has a specific evaluation and voice problem that a rounded “2.5” would obscure.
Part Two: The Seven-Stage Retention Health Check
Stage | Activity and ownership | Required inputs | Output and decision |
1. Mobilise | Chief executive sponsor; HR/OD lead; finance and service directors agree scope. | Strategy, risk register, workforce plan, known shortages. | Charter, governance, definitions and priority services. |
2. Establish the baseline | Analytics and HR reconcile employee, payroll, recruitment, absence and agency data. | Twelve to twenty-four months of quality-assured data. | Baseline scorecard, data-quality log and agreed denominators. |
3. Segment and diagnose | Services, HR, managers, networks and unions examine hotspots. | Metrics, employee voice, exit themes, workload and service evidence. | Evidence-based problem statements, not assumed causes. |
4. Prioritise | Corporate leadership considers workforce risk, service impact, cost and tractability. | Hotspot analysis, critical-role map and financial exposure. | Two to four priority workforces or problems. |
5. Design interventions | HR/OD facilitates co-design with services and employees. | Diagnostic findings, equality analysis and operational constraints. | Action plan with theory of change, owner, measures and safeguards. |
6. Deliver and track | Service directors and managers implement; HR provides assurance. | Monthly leading indicators and implementation evidence. | Decisions to continue, adapt, stop or scale. |
7. Evaluate and adapt | Analytics, finance and HR review outcomes and unintended effects. | Cohort, trend, cost and employee-experience data. | Evaluation note and next-cycle priorities. |
Part Three: The Nine-Strand Implementation Framework
Strand | Evidence and diagnostic questions | Practical response, ownership and measures |
1. Workforce intelligence and early warning | Turnover type; tenure; vacancy duration; agency use; retirement exposure; service demand. Where is risk accelerating? Is apparent improvement caused by recruitment freezes or suppressed posts? | HR/analytics owns definitions; services validate context. Build monthly hotspot views and quarterly cohorts. Leading: intention to stay, vacancy age. Lagging: turnover, critical-role retention. Avoid unsegmented averages and inconsistent denominators. |
2. Leadership, management and trust | Manager-level variation; quality of supervision; fairness; follow-through after surveys; grievance themes. Do employees trust leaders to act? | Chief executive and directors set expectations; managers hold regular one-to-ones, clarify priorities and visibly close feedback loops. Assess patterns, not manager “league tables”. Avoid management training without workload, authority or accountability to apply it. |
3. Employee voice and stay conversations | Pulse surveys, staff forums, stay and exit conversations, network and union evidence. Are employees heard before resignation? | Managers conduct confidential, structured stay conversations; HR aggregates themes and monitors action. Leading: coverage, action completion, speak-up confidence. Avoid turning conversations into individual retention promises that cannot be honoured. |
4. Career development and internal mobility | Promotion, secondment, internal applications, CPD access and succession coverage. Can people see a credible future without leaving? | Service directors map career routes; HR removes unnecessary barriers; finance protects development capacity. Use apprenticeships, rotations, shadowing and internal talent marketplaces. Measure internal fills, mobility and progression equity. |
5. Workload, job design and wellbeing | Caseload, overtime, demand, spans of control, backlog, absence and work-stress risk assessment. Which demands are structural? | Services redesign work, remove low-value activity, rebalance caseloads and increase control/support. Wellbeing support complements not replaces demand reduction. Track workload, recovery, absence and exits. |
6. Flexible and modern working | Access and refusal patterns; employee preference; output; travel; team connection and caring pressures. Is flexibility equitable and operationally viable? | Define role-based principles, predictable arrangements and review points. Measure take-up, access, retention and service outcomes. Avoid blanket attendance rules or assuming home working automatically improves wellbeing. |
7. Inclusion, belonging and psychological safety | Aggregate differences in exits, promotion, discipline, development and employee experience. Do groups experience systemic barriers? | Senior leaders own improvement; networks and unions co-design responses. Suppress small cells, combine periods where justified and restrict access to identifiable data. Never create individual “flight-risk” profiles from protected characteristics. |
8. Pay, reward and the employment offer | Pay position, market supplements, pension, leave, travel, agency comparison and perceived fairness. Is the whole offer understood and consistently applied? | HR and finance review total reward and critical-role evidence. Correct structural anomalies before using one-off payments. Track offer acceptance, pay-related exits and equal-pay risk. Avoid incentives that create two-tier workforces. |
9. Purpose, pride and recognition | Recognition quality, line-of-sight to outcomes, public hostility and professional identity. Do employees see the value and impact of their work? | Leaders communicate impact honestly; managers recognise contribution specifically and fairly; employees help tell the council’s story. Measure meaningful-work and recognition items, not communication volume. |
Stronger maturity is visible when each strand has named ownership, validated evidence, documented decisions, implementation fidelity and an evaluation trail not merely a policy or initiative.

Part Four: The Minimum Retention Data Framework
Use headcount for people-based turnover unless there is a justified reason to use FTE. State whether the denominator is opening headcount, closing headcount or average workforce, and apply it consistently.
Metric | Definition or formula | Frequency and caution |
Overall turnover | All leavers in period ÷ average headcount × 100 | Monthly rolling 12 months; separate retirement, redundancy and dismissal. |
Voluntary turnover | Voluntary resignations ÷ average headcount × 100 | Quarterly; standardise leaving-reason codes. |
Regretted turnover | Voluntary exits from roles/skills the council has prospectively defined as critical ÷ relevant average headcount | Quarterly; do not classify people retrospectively or subjectively. |
First-year turnover | Leavers within 12 months of start ÷ starters reaching comparable exposure | Quarterly by cohort; distinguish failed induction from fixed-term completion. |
Critical-role retention | Critical-role employees remaining at period end ÷ eligible employees at start | Quarterly; publish the critical-role definition. |
Vacancy rate | Vacant established posts ÷ total established posts × 100 | Monthly; distinguish active, frozen and agency-covered vacancies. |
Vacancy duration | Median days from approval or advertisement to accepted start | Monthly; report stages separately where possible. Median is usually safer than mean. |
Internal fill rate | Vacancies filled by existing employees ÷ all filled vacancies × 100 | Quarterly; distinguish promotion, lateral move and temporary cover. |
Mobility/promotion | Employees making qualifying internal moves ÷ eligible workforce × 100 | Six-monthly; high movement may reflect opportunity or instability. |
Absence | Working days lost ÷ available working days × 100 | Monthly; supplement averages with distribution and duration. |
Agency dependence | Agency FTE ÷ total workforce FTE; plus agency spend and vacancy coverage | Monthly; separate planned specialist use from vacancy substitution. |
Retirement exposure | Employees eligible or projected to retire within defined periods ÷ relevant workforce | Six-monthly; treat eligibility as exposure, never assumed intention. |
Intention to stay | Percentage giving a favourable response to a consistently worded survey item | Quarterly or six-monthly; compare with subsequent actual behaviour. |
Employee experience | Validated or consistently worded items on manager support, workload, voice, fairness, development, belonging and recognition | Use trends and confidence intervals; avoid combining unlike items into an opaque index. |
Trigger logic
Avoid universal red/amber/green thresholds. Establish:
A council baseline and seasonal pattern.
Profession- and service-specific comparators where definitions align.
Control limits or material-change rules where sample sizes permit.
Minimum cell sizes and confidence intervals.
Escalation when several indicators move together for example rising intention to leave, declining supervision quality and increased first-year exits.
Segment by service, profession, grade, tenure, contract type, location, team, working pattern and career stage. Analyse protected characteristics only in aggregate, using disclosure controls and an explicit equality purpose.
Part Five: The Retention Scorecard
Separate four types of information:
Category | Illustrative measures |
Leading indicators | Intention to stay; manager support; stay-conversation coverage; workload; development access; unresolved employee actions. |
Lagging outcomes | Voluntary, regretted and first-year turnover; critical-role retention; absence; internal fill rate. |
Context | Labour-market supply; retirement exposure; restructures; demand levels; pay changes; policy change. |
Financial/service impact | Agency and overtime spend; vacancy days; backlog; statutory timeliness; continuity; complaints or quality measures. |
Interpret movement as a pattern, not a verdict. A falling vacancy rate may reflect successful recruitment, but it may also reflect deleted or frozen posts. Rising internal fills may signal development, or merely move vacancies elsewhere. Agency use may protect services in the short term while masking an unresolved employment-offer problem.
Useful analyses include:
Cohort retention: compare joiners by quarter, profession or recruitment route.
First-year survival: show the proportion remaining after 3, 6, 12 and 24 months.
Hotspot analysis: identify combinations of high turnover, long vacancies, absence and weak employee experience.
Vacancy-to-turnover loops: test whether long vacancies precede workload increases and subsequent exits.
Pre/post comparison: compare trends before and after an intervention, ideally with a similar untreated team.
Difference-in-differences or interrupted time-series analysis: use where data quality, sample size and implementation timing justify it.
These analyses strengthen inference but do not automatically prove causality. Most broader retention research remains dominated by cross-sectional studies, making local evaluation particularly important.

Part Six: Governance
Chief executive and corporate leadership: sponsor the system; agree risk appetite; challenge service hotspots; remove cross-council obstacles.
HR/OD/workforce: steward definitions, diagnostics, practice standards, manager support and assurance.
Finance: quantify agency, overtime, vacancy and intervention costs; test whether savings are realised or simply displaced.
Service directors: own retention outcomes and workforce plans in their services.
Line managers: create the everyday employment experience and act on local evidence.
Analytics: quality-assure data, produce cohorts and evaluate interventions.
Employee networks and trade unions: provide collective intelligence, co-design solutions and test fairness.
Audit/risk committees where appropriate: assure material workforce and service-continuity risks, not routine operational detail.
Use monthly operational reviews for priority teams, quarterly corporate leadership review and an annual public or workforce-plan narrative. Connect decisions to the medium-term financial plan, service plans, transformation portfolios and the corporate risk register.
Part Seven: Mobilisation
First 30 days
Appoint the sponsor and programme lead; agree definitions; identify critical roles; map data; establish privacy rules; select two to four priority areas; and issue a short mobilisation charter.
Days 31–60
Build the baseline dashboard; undertake segmentation; run targeted stay conversations and focus groups; assess workload and job design; and produce evidence-based problem statements.
Days 61–90
Approve intervention plans; establish implementation and outcome measures; train accountable managers; set financial baselines; and begin delivery.
Twelve-month cycle
Months 1–3: mobilise, baseline and diagnose.
Months 4–6: implement selected interventions and monitor fidelity.
Months 7–9: review leading indicators, adapt weak delivery and investigate unintended effects.
Months 10–12: evaluate outcomes, refresh priorities, integrate learning into workforce and service plans and publish an internal evidence note.

Part Eight: Practical Toolkit
Priority-workforce diagnostic
Workforce/service:
Why critical:
Current vacancy, turnover, first-year exit, absence and agency position:
Groups or stages most affected:
Employee evidence:
Workload/service evidence:
Most plausible causes:
Evidence contradicting those causes:
Immediate controls:
Longer-term intervention:
Owner, measures and review date:
Stay-conversation framework
Ask: What helps you stay? What makes work harder than it should be? When have you recently considered leaving? What would improve the next six months? Are your skills being used? What development or flexibility matters? What should your manager, service or council do differently?
Record themes and agreed actions not intimate personal information or unsupported predictions about the individual.
Intervention action plan
Problem | target cohort | evidence | intended mechanism | actions | accountable owner | resources | leading indicators | lagging outcomes | equality/privacy safeguards | implementation checks | review date | stop/adapt/scale criteria
Quarterly executive questions
Where is workforce risk increasing before turnover rises?
Which critical services have mutually reinforcing vacancy, workload and agency problems?
What have employees said, and what has visibly changed?
Which interventions were delivered as designed?
Are outcomes improving for all relevant cohorts?
What has been stopped because it did not work?
What service, financial or governance decision is required now?


